A guide on deciding the best dashboard software type for your business

Entry posted by Chooli in Entrepreneur
7,063 views
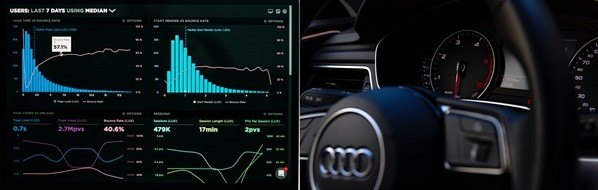
Just like how our car’s dashboard gives us real-time data about how our car is performing, dashboard software collects data that can optimize business management and contribute to the overall success of the company. In just a glance, dashboard softwares helps merchants and business owners have a better grip of their business’ performance by creating data visualizations (charts, graphs, scales, etc) to evaluate their operations at any time. This will eventually help them have better forecasts for the future, mitigate risks and make informed and sound business decisions based on facts.
It is clear now that data runs the world of business, and this is why more and more businesses are investing in analytic services like dashboards to change the way their business intelligence strategy is made.
The greatest feature of a dashboard is that it is highly customizable. This strength allows you to keep track of almost all measurable aspects of your company tailoring it to the user’s specific needs and objectives. The most important thing is to take the time to develop and design your dashboards to get the most of them, turning them into high-performance tools that enable your company to rise above the competition.
Dashboards are not one-type-fits-all softwares, and it’s not uncommon to be confused and overwhelmed with all there is out there. Not just any dashboard will meet your specific needs, therefore it is essential to choose the right ones to support your company’s growth. You may have a healthy approach and make smart moves in your business development but if you don’t communicate the right sets of data to the right people in your company, your success can be jeopardized and might entail you to spend more.
In selecting the best dashboard, it’s important to ask yourself these three questions:
What are the problems you need to solve?
What are your business’ needs?
What are your business’ goals and objectives?
You will create your platform based on your answers to these questions.
It is no doubt that dashboard softwares are swiftly taking over the world of business intelligence. But as important as getting a dashboard to optimize your business efficiency is designing and creating it based on a clear understanding of the kind of dashboards you need.
In creating a dashboard that is best for your business, it is vital to consider the know-how of the different types of dashboards, and then make a choice based on which is most ideal for your own context.
To help you in making this decision, in this article we share with you three major types of dashboard softwares that are essential for you depending on your business needs and objectives.
Operational Dashboards
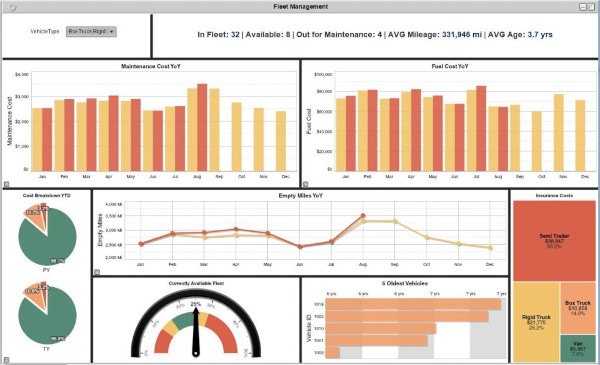
Operational Dashboard is the most common type and is the most frequently used. It is a reporting tool that is used to monitor business processes that constantly change and to track current performances of key metrics. Compared to other types of dashboards, this type provides at-a-glance data that updates very frequently, sometimes even on a minute-by-minute basis.
Operational dashboards are designed to be viewed multiple times throughout the day. They are often used to view data related to the operational aspects of your business and to monitor progress towards a goal.
Business owners depend on operational dashboards to monitor their employees’ progress and movements. They are also notified of issues as they arise in order to address them immediately. This type of dashboard provides real-time information, gathered in one place, making it easier for employees to act and make quick decisions without having to dig through large amounts of files for data.
This is the dashboard type that is best-suited to be on a wall display on the work floors, or in the manager’s office.
With this type, the viewer does not have the option to manipulate the data. Therefore, when building an operational dashboard, it has to have a detailed view and you have to make sure that the scope does not become too wide. Sometimes presenting too much information can be confusing and unclear. Make sure you know your end users and the data they would need to see to perform their tasks effectively.
Strategic Dashboards
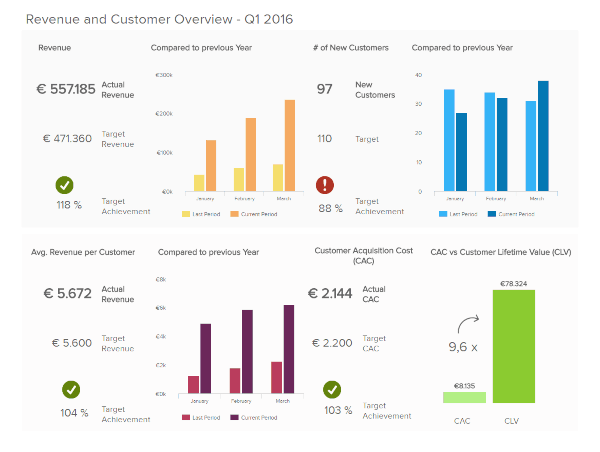
As the name suggests, strategic dashboards are designed to give strategic guidance for your business by providing long-term blueprints with the help of critical success indicators. It gives a bird's-eye view of your business, and can contain anything from overall sales numbers to sales and revenue comparisons, or inventory monitoring, making it easy for executives to understand the overall situation of the company. The success of your business is affected by several key factors, so through an accumulation of data, analysis and comparisons provided by this dashboard, owners can see if things have changed, stayed the same or improved, and decide the next move based on that.
This is perfect for senior managers and executives, as they assist in pointing out potential windows for business improvement, and are also often used to align departmental performance with the overall business strategy. These dashboards tend to summarize performance over time frames: past month, quarter, or year.
Through this, specific departments can further analyze operations and senior members of a team can identify strategic concerns immediately and provide comprehensive strategic reports with the analyzed data. Basic qualitative and quantitative data, and identifying a specific system has to be incorporated into the dashboard so that every decision-maker understands the interpreted data.
When properly developed, designed, and implemented, it can effectively lessen the amount of time needed to carry out a specific key success indicator, while reducing operational costs.
Analytical Dashboards
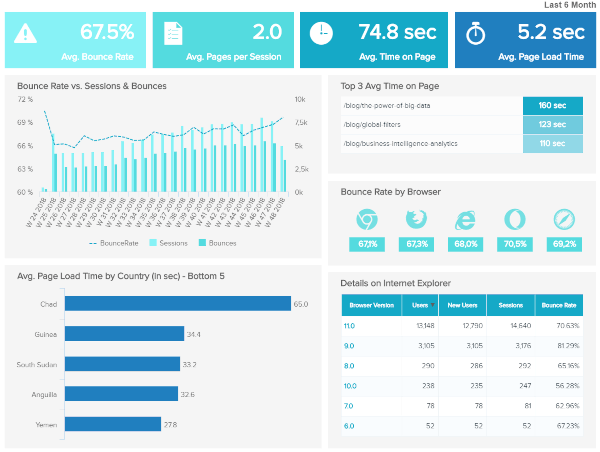
The Analytical type of dashboard provides users with insights and projections from a volume of data accumulated over time, enabling users to understand the cause of certain happenings, and what changes have to be done in the future in order to address them.
Understanding the trends and events in your data is important when it comes to determining and implementing effective business strategies. Analytical dashboards provide you detailed information that allows you to make a comparison of current and historic data as you enjoy in-depth analysis, identify patterns and opportunities in your data, to find out why processes are working in certain departments. With this dashboard, you can explore valuable insights to improve your overall business performance. These dashboards allow users to interact with data exploration and reveal valuable insights with features like filters, brushing, series selection, data drilling, and other features.
Because of this, the data in analytical dashboards may be more complicated and usually requires advanced training to manage. This is why this type is generally used by business analysts or experts instead of just regular employers. Analytical dashboards are best left to your database analysts as instead of the whole company, as they require a level of understanding that the average business user may not possess. Therefore, defining user permissions is a great way to ensure that your analytical dashboards are being presented to the right group.
Types of dashboard software
| Type of Dashboard | Function | Data update time frames | Best for what type of audience/users |
|---|---|---|---|
| Operational | Used to view detailed at-a-glance data related to the operational aspects of your business and data that constantly change within the day | Provides minute-by-minute data updates | Regular employees, managers |
| Strategic | Give strategic guidance for your business by providing long-term blueprints with the help of critical success indicators | Summarize performance over time frames: past month, quarter, or year | Department heads, Senior managers, executives and other key decision-makers in the company |
| Analytical | Provides insights and projections from a volume of data accumulated over time, enabling users to understand the cause of certain happenings, and what changes have to be done in the future in order to address them. | Summarize performance over time frames: past month, quarter, or year | Business analysts, Specific department heads, senior managers, executives |
Conclusion
Of course, the best option is to have all three different types of dashboards to help you steer your business. From this point of view, it is essential to understand that creating your own dashboard is not something to take lightly. It requires serious deliberation and consideration of your business needs and objectives. Also, keep in mind that it is of vital importance for dashboard users to constantly update their data and input to allow the software to produce more accurate and informed data interpretations.
We hope this article has helped you in making that decision for the betterment of you and your business.
-
 2
2
-
 1
1
1 Comment
Recommended Comments
Please sign in to comment
You will be able to leave a comment after signing in
Sign In Now